What a $35 million abandoned project reveals about loss aversion in high-stakes business decisions.
My friend had another drink from his tea and said “One of the reasons the drugs are expensive is emotional attachment.”
I looked surprised and said “I didn’t understand.”
He continued “Some decision makers are obsessed with the projects that they are driving. Although outcomes show the development is not successful, they are keen to carry on.”
My question was related to the cost: “How much does this cost?”
He replied calmly, “It could cost up to a couple of million dollars.” Then added, “Increasing decision-making competency is so important to save money, time and energy.”
I asked with curiosity, “Aren’t there experts who share these and warn them?”
He was so sure about his answer “Yes, they are — but even though the project is dead, they keep spending additional funds to show there could be a way around it. That usually means a delay of a couple of years.”
I was stunned. I’d always found drugs expensive and believed they should cost less — because health is for everyone. Now I understood that the reason wasn’t technology or science.The reason was the field I have been working on for years.
My friend was working for a global pharmaceutical company and he was kind enough to share these insights when we met up to talk about rational decision-making.
Pharmaceutical Industry Landscape
Market Size & Growth
The global pharmaceutical industry’s market size was approximately $1.77 trillion in 2025, and is projected to approach $2.0 trillion by 2026–2027 (Precedence Research, 2025). North America held a 42% share of the global pharmaceutical market in 2024, while Asia-Pacific is projected to be the fastest-growing region through the next decade (Precedence Research, 2025). Developing a new drug is a costly process, meaning bad decisions are exceptionally costly.
Common Decision-Making Pitfalls
In the Pharma Industry, Sunk-cost fallacy and emotional attachments to long-term projects result in millions of dollars lost. I explained this bias in one of my previous articles, Sunk Cost Fallacy: Definition & Why It Traps Us, if you’d like to learn more about how it causes problems across different fields.

Another common pitfall is data silos. Teams often operate in silos or examine data sets in isolation. Without centralized collaboration spaces, trend analysis, or unified “data synergy,” decisions get slowed down in debate rather than driven by a clear, big-picture narrative.
The third pitfall is that disconnects between commercial leaders and technical experts lead to massive redundancies—like spending $400k on extra clinical trials as estimates suggest just to settle internal doubts.
Industry Pipeline Activity
On the other hand, despite the decision mistakes, as of early 2025, industry estimates suggest over 6,800 pharma companies have active R&D pipelines, collectively pursuing around 24,000 drugs in development worldwide.
In the light of these figures, making the right decision is so important in the pharma industry. Poor decisions not only impact industry players but also the public, who end up paying more for these costly mistakes. If you would like to learn what the right decision is and what a rational decision is please check What makes a decision rational vs right?
A Real-World Scenario: Betting on a New Drug
Believe Pharmaceuticals is eager to expand its product portfolio with a hypertension drug. Hypertension is an emerging area of concern, with a year-over-year increase in diagnoses. According to statistics from the World Health Organization, the number of adults aged 30-79 living with hypertension worldwide nearly doubled — rising from 650 million in 1990 to 1.4 billion in 2024 — with the increase concentrated largely in low- and middle-income countries. Women are diagnosed and treated at notably higher rates than men once they have the condition. Separately, more than 2 in 5 Americans with high blood pressure (40.8%) don’t know they have it. Therefore, the board of the company decided to pursue more market share in this field.
To do that, let’s assume the leadership team organized a brainstorming session, and four strategies were identified. If you would like to get more information regarding how to do brainstorming activities properly in group settings you can check The Importance & Difficulty Matrix: How to Find Your Strategic Priorities.
If the product sees high demand, the revenue estimate is $180 million (probability 0.35). If demand is low, the revenue estimate is $80 million (probability 0.65). These figures apply to all four alternatives.
First Alternative: Hiring a research team
The first is to hire a research team of 150 people to develop new drugs. However, developing a new drug is expensive — roughly $60 million — and there’s uncertainty about whether the outcome will be accepted by the Food and Drug Administration (FDA), since regulatory requirements can be strict. The probability of success is estimated to be about 20%.
Second Alternative: Acquire a small company
Chest Business Inc. has already developed a drug that is currently undergoing clinical trials. If the trials are successful, the FDA will license the product, so this alternative is more likely to succeed. According to the executive director of Chest Business, the probability of success is about 0.2. On the other hand, the cost of this taking over Chest Business is very high, about $120 Million.
Third Alternative: Buy a License
Buying a license is another alternative. At $170 million, it’s the most expensive of the four — though it removes most of the development risk, since the drug is already proven. Still, the probability of success is about 0.2.
Fourth Alternative: Reiterate Old Project
A couple of years ago, a small team of Believe Pharmaceuticals worked on a similar project and ran the clinical trial tests for it. However, the project didn’t meet FDA regulatory requirements, so the project was shelved. That said, the project manager noted they were close to approval but needed a few more rounds of clinical trials. The cost of completing the project is $35 Million and the probability of success is 0.6.
“Whether you think you can or you can’t, you’re right either way.”
Henry Ford
The Decision Tree
The five alternatives are illustrated in the decision tree below. A decision tree is a useful method for visualizing alternatives that involve uncertainty. In order to get more information about building a decision tree, you can check the article How to use a decision tree for better decisions article.
If we build a decision tree for this use case, it can look like this:
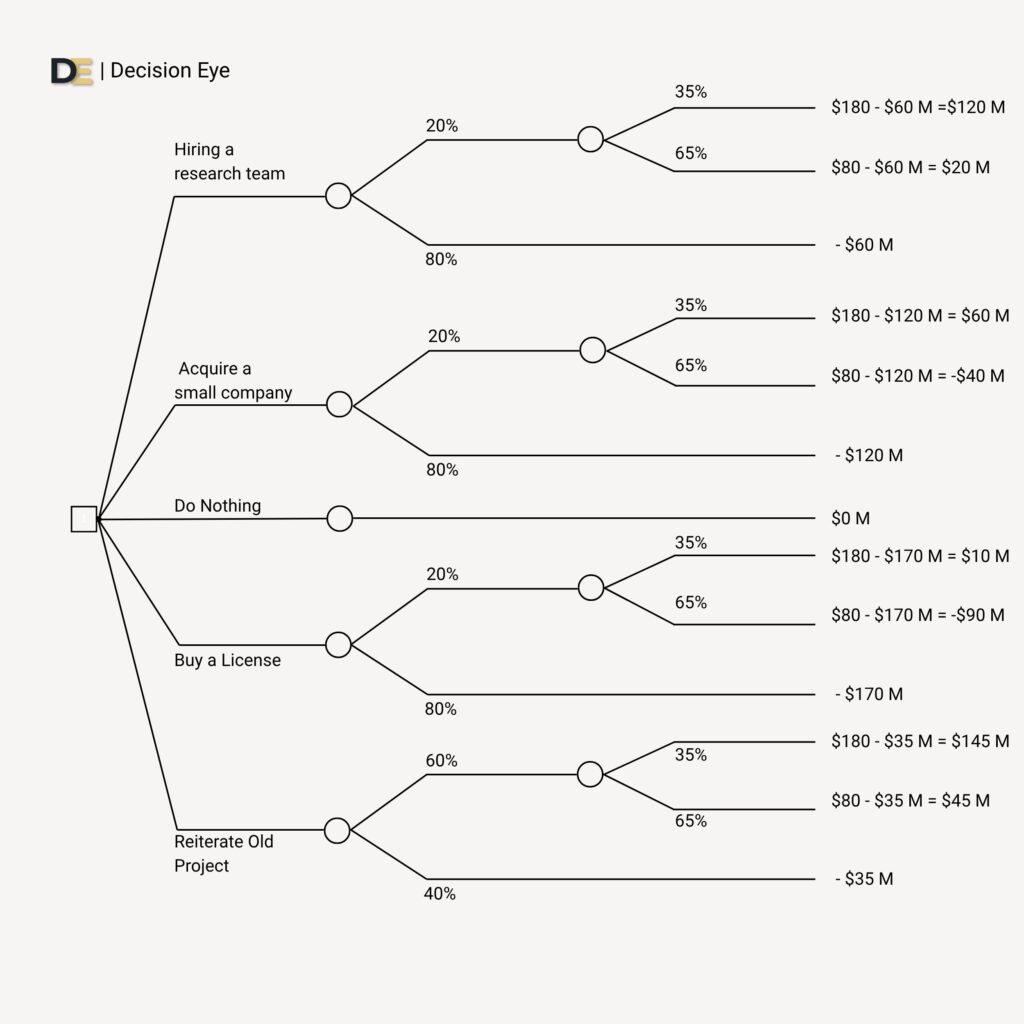
Unfortunately, many companies and organizations don’t even get this far when making their go-to-market decisions. Based on my observations, after long, unstructured brainstorming sessions, professionals tend to get bored and intuitively choose whichever option seems most convenient. As human beings, we’re responsible for many things, and like other professionals today, we live under constant information overload. These conditions can lead professionals into the paradox of choice or decision fatigue. You can check out Decision Fatigue: What It Is & How to Overcome It Daily and Paradox of Choice: How Too Many Options Hurt Your Decisions.
The Expected Utility
Believe Pharmaceuticals Inc.’s leadership team would like to understand which alternative is better than the others. After a clear picture of risks and outcomes, they analyze the expected utility for each alternative and compare. In his book, An Introduction to Decision Theory, Mark Peterson explains this concept and why there are different approaches and their respective differences. The Expected Utility is the most commonly applied decision rule for making decisions under risk. This principle explains that the total value of an act equals the sum of the values of its possible outcomes weighted by the probability.
Factoring In Loss Aversion
On the other hand, after conducting a series of interviews and brainstorming sessions within the company, the executive leadership team is able to create a formula regarding utility as u = 3 x L According to the inputs from various stakeholders, the company’s loss tolerance is low — in fact, losses are weighted three times as heavily as gains. This is a psychological concept explained in Thinking, Fast and Slow by Daniel Kahneman and based on his research with Amos Tversky, a concept known as Loss Aversion.
Loss Aversion is also common in our ordinary lives today and even thousand years ago. In his iconic book The Richest Man in Babylon, George S. Clason recounts a conversation between a spear maker and a banker. The king of Babylon had rewarded the spear maker with gold for his remarkable spear design for soldiers. However, his sister asked him for the gold to help her son start a business. The confused spear maker consulted the banker for this request and the conversation between them is a great example of loss aversion and wise insight from ancient times.
In a nutshell, Believe Pharmaceuticals’ leadership team understands that the company has little tolerance for loss.
Four Step Calculation
1. Step: Determining Probabilities
Hiring a Research Team
The success rate for hiring a research team is 20%. Once the drug is developed, market demand determines revenue — a 35% chance of high demand and a 65% chance of low demand.
Big success: 0.2 × 0.35 = 0.07
Small success: 0.2 × 0.65 = 0.13
Acquire a Small Company
Similarly, acquiring a small company carries the same 20% success rate, since it still depends on the same FDA approval and demand outcomes.
Big success: 0.2 × 0.35 = 0.07
Small success: 0.2 × 0.65 = 0.13
Buying a License
Buying a license follows the same logic, so the probability values are identical to the first two alternatives.
Big success: 0.2 × 0.35 = 0.07
Small success: 0.2 × 0.65 = 0.13
Reiterating the Old Project
In contrast, reiterating the old project has a much higher success rate of 60%, since the earlier trials had already made significant progress before being shelved.
Big success: 0.6 × 0.35 = 0.21
Small success: 0.6 × 0.65 = 0.39
2. Step: Monetary Outcome of Each Alternatives
Hiring a Research Team
Developing a new drug this way costs $60 million, against revenue estimates of $180 million for high demand and $80 million for low demand.
Big success: $120 million
Small success: $20 million
Acquire a Small Company
At $120 million, acquiring Chest Business Inc. is considerably more expensive than building an in-house team.
Big success: $60 million
Small success: –$40 million
Buying a License
Meanwhile, licensing an existing drug from a rival costs $170 million — the highest upfront price of the four options.
Big success: $10 million
Small success: –$90 million
Reiterating the Old Project
By comparison, finishing the shelved project costs only $35 million, since much of the clinical work is already done.
Big success: $145 million
Small success: $45 million
3. Step: Calculate Utility
In the previous section, maximizing the expected utility principle was mentioned. If Believe Pharmaceutical would be natural for loss then the standard formula could be considered for calculations. However, after a series of interviews and brainstorming sessions, it has been determined that the company’s tolerance is lower for loss. Therefore, the utility formula for them regarding loss is:
In the light of these, updated formula is:
In a nutshell, the utility of success keeps as it is but the utility of loss has a multiplication factor of 3 because of companies’ loss aversion.
Let’s calculate expected utility of each alternative:
Hiring a Research Team
Acquire a Small Company
Buying a License
Reiterating the Old Project
Actually there is one more alternative: doing nothing on the decision tree. It has an expected utility as well.
4. Step: Compare Alternatives
According to comparison of Expected Utilities Reiterating the Old Project is the best alternative.
| Alternative | Cost | P(Success) | Expected Utility |
| Hiring a Research Team | $60M | 20% | −$133M |
| Acquiring a Company | $120M | 20% | −$278.6M |
| Buying a License | $170M | 20% | −$419M |
| Reiterating the Old Project | $35M | 60% | $6 M |
| Do Nothing | — | — | $0M |
Therefore, the leadership of the company decided to reiterate the old project.
In any moment of decision, the best thing you can do is the right thing, the next best thing is the wrong thing, and the worst thing you can do is nothing.
Theodore Roosevelt
What If the Loss Tolerance Were Different?
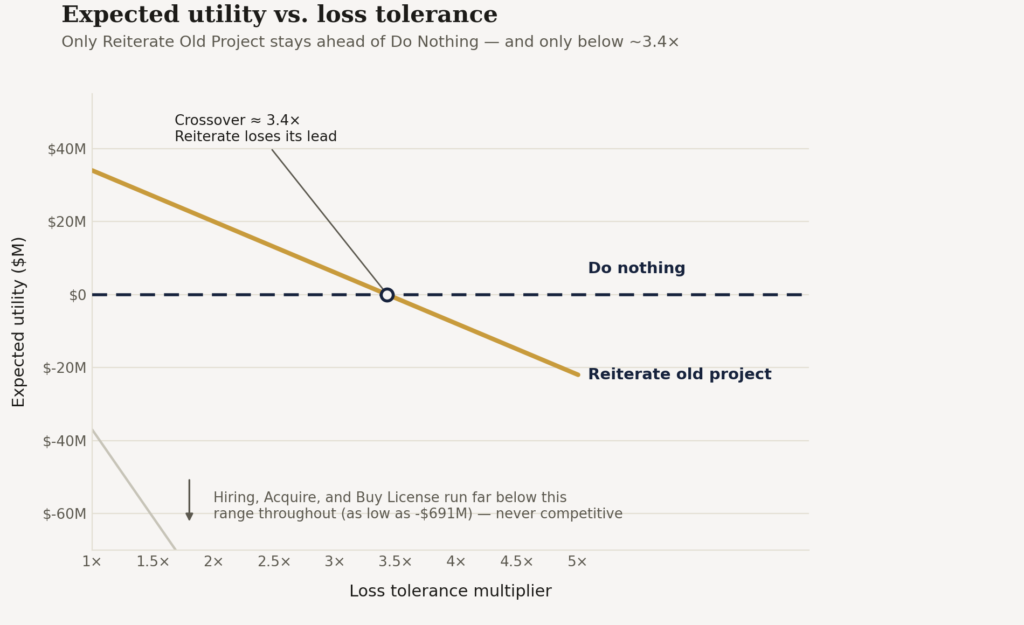
At 1× — treating a loss the same as an equivalent gain — Reiterating the Old Project is the clear winner at +$34M, comfortably ahead of Do Nothing. As loss tolerance rises, that lead narrows: +$20M at 2×, +$6M at 3×, and it disappears entirely past roughly 3.4×, where Do Nothing finally takes over. Hiring a Research Team, Acquiring a Small Company, and Buying a License never become competitive at any of these levels — their downside is simply too large relative to their upside, regardless of how heavily losses are weighted. The one number that actually decides this case study isn’t the market forecast. It’s how much the board fears losing money in the first place.
Conclusion
In fact, the results and calculations may surprise you, but this kind of outcome is common in the business world. I’ve worked with business leaders and companies who chose to do nothing — not because their expected utility was negative, but because even a positive result wasn’t worth it given their low tolerance for loss. In the calculations above, the main point which impacted the result is Believe Pharmaceuticals’ opinion about loss. Reiterate Old Project wins outright, not conditionally on higher loss tolerance. The conclusion needs to shift from “they were right to do nothing” to the numbers actually favored finishing the old project — the company almost walked away from the right answer.
A Note on This Analysis: In preparing this case study, we caught and corrected a few calculation errors in our working numbers before publishing — a reminder that even careful analysis needs a second pass.
How to Decide Your Go-to-Market Strategy
Here you can use a six-step approach approach for your Go-To Market Decisions
- Do your homework: Do your research about the market, competitors, customers and their segmentation. On top of that a bit of history regarding the market would give better insight.
- Find Alternatives: Think about alternatives and generate as many ideas as possible. You could use brainstorming techniques for group settings.
- Design a decision tree: Put your refined alternatives into the decision tree with probability of success and failure with their respective outcomes. This will give you a clear picture about your Go-To-Market Decision.
- Calculate Utilities: Check each alternative’s utility by using the principle of maximizing the expected utility. Also, please be aware of loss aversion. The organization may not tolerate the loss then conduct interviews and research to understand their utility function.
- Compare Alternatives: Find the best alternative based on a comparison of expected utilities.
- Think Beyond: Finding the best alternative does not guarantee success. It depends on execution. Even in the case study, each alternative — hiring a research team, acquiring a company, and so on — still requires successful execution to deliver results. Making a decision is not the end of the process but the beginning.
Try It Yourself: Expected Utility Calculator
Expected Utility Calculator
Model your own go-to-market alternatives the way we modeled Believe Pharmaceuticals’. Edit any number below and every result updates instantly — including what happens to the ranking as your tolerance for loss changes.
Market Assumptions
Applied to every alternative below — the same “if demand is high vs. low” split used across the case study.
Loss Tolerance
How much more heavily a loss is weighted than an equivalent gain — the “u = n × L” multiplier from the case study.
Your Alternatives
Preloaded with the four alternatives from the case study, plus “Do Nothing.” Rename, edit, add, or remove any of them.
Results — Ranked by Expected Utility
Bars extend right for a positive expected utility, left for a negative one.
▸ How this is calculated
References
- World Health Organization. (2025, August 24). Hypertension. https://www.who.int/news-room/fact-sheets/detail/hypertension
- Peterson, M. (2017). An introduction to Decision Theory (2nd ed.). Cambridge University Press.
- Kahneman, D. (2011). Thinking, fast and slow. Farrar, Straus and Giroux.
- Clason, G. S. (2002). The richest man in Babylon. Signet.

Timucin Tasdemir, M.Sc.
Decisions aren’t found. They’re built.
I write about decision-making, cognitive biases, and decision architecture at Decision Eye. Most poor decisions come not from a lack of intelligence, but from a lack of structure.
Disclaimer: The views and opinions expressed in this article are solely my own and do not reflect the official policy or position of any past, present, or future employer or affiliated organisation. This content is intended for informational and educational purposes only and does not constitute professional advice.
Leave a Reply